March 24th, 2016 • Comments Off on A data center resource and service landscape
Telemetry and Monitoring systems give a great visibility into what is going on with the resources and services in a data center. Applying machine learning and statistical analysis to this massive data source alone often leads to results where it becomes clear correlation ain’t causation.
This brings the need for understanding of “what is connected to what” in a data center. By adding this topology as a data source, it is much easier to understand the relationships between two entities (e.g. a compute node and it’s Container/VM or a block storage and the NAS hosting it).
One of the ultimate goals we have here in Intel Labs is to put the data center on autopilot and hence we try to answer the Q:
how to efficiently define and maintain a physical and logical resource and service landscape enriched by operational/telemetry data, to support orchestration for optimized service delivery
We have therefore come up with a landscape graph model. The graph model captures all the entities in a data center/SDI and makes their relations explicit. The following diagram shows the full-stack (from physical to virtual to service entities) landscape of a typical data center.
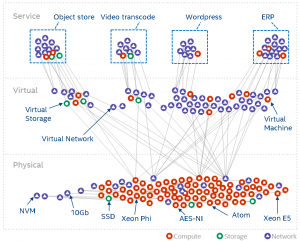
(Click to enlarge)
The graph model is automatically derived from systems such as OpenStack (or similar) and allow us to run all kinds of analytics – especially when we combine the graph model and annotate it with with data from telemetry systems.
As one example use case for using the landscape and annotate it with telemetry data, this paper shows a way to colour the landscape for anomaly detection.
Categories: Work • Tags: Cloud, data center, Orchestration, Scheduling, SDI • Permalink for this article
March 21st, 2016 • 1 Comment
Orchestration and Scheduling are not the newest topics, in fact they have been used in distributed systems forever (as in a couple of decades :-)). Systems like Mesos and Kubernetes (or offerings like Mantl) have brought advancements when it comes to dealing with scale. Other systems have a great background in scheduling and offer many (read a whole lot) policies for the same, this includes technologies like Grid Engine, LSF/OpenLava, etc.. Actually some of these technologies integrate with each other (like navops, Kubernetes and Mesos, OpenLava and Mesos, …), which makes it for example interesting when dealing with scheduling for space & order at the same time.
Next to pure demand, upcoming trends like CNCF & OCI as well as the introduction of Software Defined Infrastructure (SDI) drive the number of resources and services the Orchestrators and Controllers manage up. And the Question arises how to efficiently manage your data center – doing it by a human pressing a button is just not going to scale 🙂
Feedback control systems are a great start, however have some drawbacks. The larger the scale the more conflicts you might get between the feedback loops. The approaches might work up to rack level but probably not much beyond that. For large scale we need an approach which works along the lines of watch (e.g. by using snap), learn/decide (e.g. by using TAP) and act (See Jason Waxman’s keynote at OCP). This will eventually allow for a operatorless/humanless/driverless operations of the data center to support autonomous operations for scaling, healing and optimizing e.g. TCO.
Within Intel Labs we have therefore come up with the concept of a foreground and a background flow. Within a continuously running background flow we observe (if needed over long time-periods) the data center with its resources and services and try to derive & update models heuristics (read: rule of thumb) continuously using analytics/machine learning. Within a foreground flow – which sometimes is denoted the fast loop as it needs to perform – we can than score against those heuristics/models in actions plans/recipes.
The action plan/recipes describe a process on how we deal with a initial placement or re-balancing event. The scoring will allow for making better initial placement (adding a workload) as well as re-balancing decisions (how/what/when to kill, migrate or tune the infrastructure). How to derive an heuristics is explained in a paper referenced below – the example within that is about to learn how to best place a VNF so that is makes optimal use of platform features such as SR-IOV. Multiple other heuristics can easily be imagined, like learning how many cores a certain workload needs.
The following diagram shows the background and foreground flow.
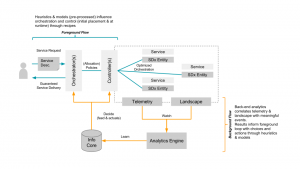
(Click to enlarge)
The heuristics are stored in an Information Core which based on the environment it is deployed in tunes itself. We’ve defined the concepts described here in a paper submitted to the Middleware 2015 conference. The researchers from Umea (who also run this highly recommended workshop) have used it and demonstrate an example use case in the same paper. For an example on how a background flow can help informing the foreground flow read this short paper. (Excuses for the paywall :-))
I’ll follow-up with some more blog posts detailing certain aspects of our latest work/research, like how the landscape works.
Categories: Work • Tags: Analytics, Cloud, data center, Machine Learning, Orchestration, Scheduling, SDI • Permalink for this article
October 20th, 2011 • Comments Off on Forget static callgraphs – Use Python & DTrace!
Forget about static analyzed callgrahs! No more running the code closing it and then looking at the callgraph. With DTrace you can attach yourself to any (running) process on the (running/production) system and get life up to date information about what the programm is doing. No need to restart the application or anything. This works for most programming languages which have DTrace providers (like C, Java and Python :-)). All you need to know is the pid.
Based on the information you get from DTrace (using the Python consumer) you can draw life updating callgraphs of what is currently happening in the program. Not only is it possible to look at the callgraph but you can also look at the time it took to reach a certain piece of code to analyze bottle necks and the flow of the program:
$ pgrep python # get the pid of the process you want to trace
123456
$ ./callgraph.py 123456 # trace the program and create a callgraph
So if you would have the following Python code:
class A(object):

    def sayHello(self):
        return 'I am A'


class B(object):

    def __init__(self):
        self.a = A()

    def sayHello(self):
        return self.a.sayHello()


if __name__ == '__main__':
    print B().sayHello()
You would get the following life generated callgraph – the GUI can start, stop and restart tracing and get live updates as the DTrace probes fires:

Click to enlarge
The following screenshot was taken while looking into the printer manager:

Click to enlarge
DTrace for the win!
[Updated] Updated the screenshots.
Categories: Personal, Work • Tags: DTrace, Python • Permalink for this article
October 19th, 2011 • Comments Off on Python traces Python using DTrace
Another example of how to use Python as a DTrace consumer. This little program traces a Python program while is runs and shows you the flow of the code. The output is displayed in a Treeview (An indent mean that python called another function – Stepping back means that the function returned) and when double clicking the source code is displayed (Would be nice to open pydev as well).

Click to enlarge
Another example of Python as a DTrace consumer: This small GUI gives an up to date view of the number of syscalls made by an executable. Since this GUI is a live up to date view you can watch the circles appear, grow and become smaller again 🙂

Click to enlarge
Now on to other things…maybe creating live animated callgraphs as your program runs? 😛
Categories: Personal, Work • Tags: DTrace, Python • Permalink for this article
October 8th, 2011 • Comments Off on Python as a DTrace consumer – Part 2 walk the aggregate
Yesterday I blogged about how to use Python as a DTrace consumer with the help of ctypes. The examples in there are very rudimentary and only captured the normal output of DTrace – not the aggregates.
The examples in the last post have been altered and now we let DTrace work for a few seconds and then walk the aggregate:
    # aggregate data for a few sec...
    i = 0
    chew = CHEW_FUNC(chew_func)
    chew_rec = CHEWREC_FUNC(chewrec_func)
    while i < 2:
        LIBRARY.dtrace_sleep(handle)
        LIBRARY.dtrace_work(handle, None, chew, chew_rec, None)

        time.sleep(1)
        i += 1

    LIBRARY.dtrace_stop(handle)

    walk_func = WALK_FUNC(walk)
    # sorting instead of dtrace_aggregate_walk
    if LIBRARY.dtrace_aggregate_walk_valsorted(handle, walk_func, None) != 0:
        txt = LIBRARY.dtrace_errmsg(handle, LIBRARY.dtrace_errno(handle))
        raise Exception(c_char_p(txt).value)
The walk function is right now very simple but does work – please note the TODO 🙂
def walk(data, arg):
    '''
    Aggregate walker.
    '''
    # TODO: pickup the 16 and 272 from offset in dtrace_aggdesc struct...

    tmp = data.contents.dtada_data
    name = cast(tmp + 16, c_char_p).value
    instance = deref(tmp + 272, c_int).value

    print '+--> walking', name, instance

    return 0
When run the Python script will output (Would be fun to run this DTrace script with the help of Python – Python as a DTrace consumer tracing Python as DTrace provider :-P):
./dtrace.py
+--> In chew: cpu : 0
  +--> In out:  Hello World
+--> walking updatemanagernot 2
+--> walking mixer_applet2 4
+--> walking gnome-netstatus- 135
+--> walking firefox-bin 139
+--> walking gnome-terminal 299
+--> walking python2.7 545
Error 0
Overall this works pretty smoothly – but needs a lot of updating before it is production ready – Still it gives an rough overview that Python can be a simple DTrace consumer while using ctypes. So now Python can be consumer and provider for DTrace *happy days* 🙂
The code (examples) have been updated on github.
Categories: Personal, Work • Tags: DTrace, Python • Permalink for this article
Page 1 of 1712345...10...»Last »


