A data center resource and service landscape
March 24th, 2016 • Comments Off on A data center resource and service landscapeTelemetry and Monitoring systems give a great visibility into what is going on with the resources and services in a data center. Applying machine learning and statistical analysis to this massive data source alone often leads to results where it becomes clear correlation ain’t causation.
This brings the need for understanding of “what is connected to what” in a data center. By adding this topology as a data source, it is much easier to understand the relationships between two entities (e.g. a compute node and it’s Container/VM or a block storage and the NAS hosting it).
One of the ultimate goals we have here in Intel Labs is to put the data center on autopilot and hence we try to answer the Q:
how to efficiently define and maintain a physical and logical resource and service landscape enriched by operational/telemetry data, to support orchestration for optimized service delivery
We have therefore come up with a landscape graph model. The graph model captures all the entities in a data center/SDI and makes their relations explicit. The following diagram shows the full-stack (from physical to virtual to service entities) landscape of a typical data center.
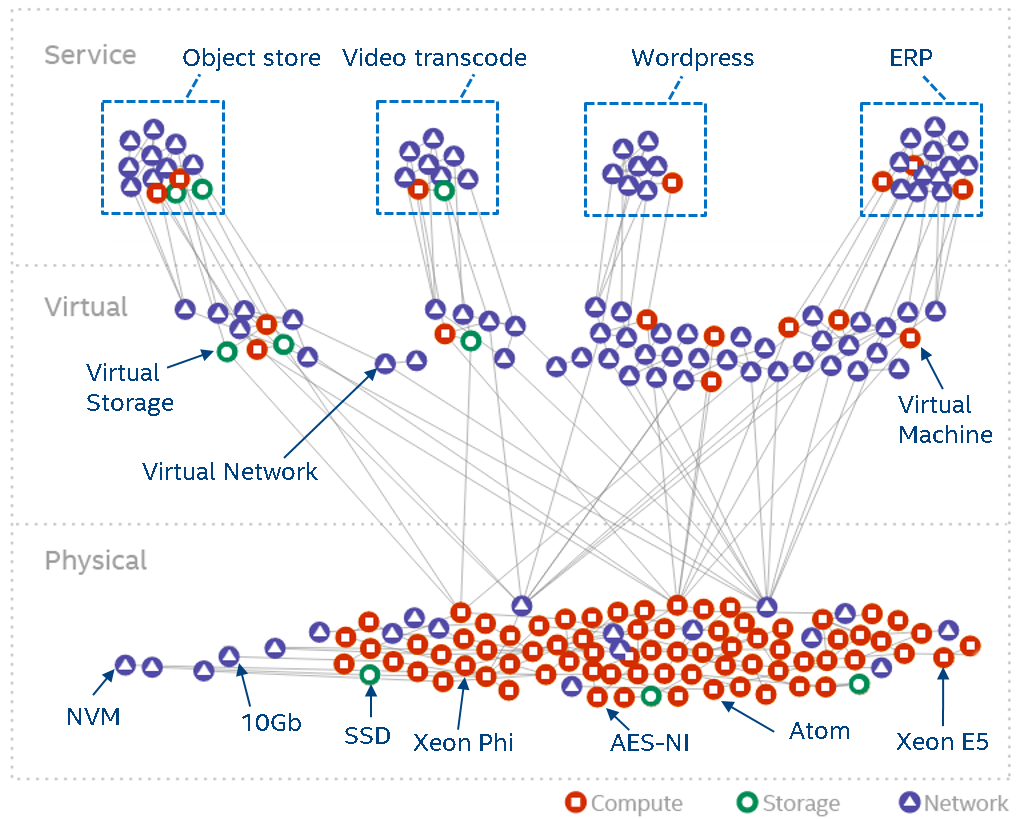
(Click to enlarge)
The graph model is automatically derived from systems such as OpenStack (or similar) and allow us to run all kinds of analytics – especially when we combine the graph model and annotate it with with data from telemetry systems.
As one example use case for using the landscape and annotate it with telemetry data, this paper shows a way to colour the landscape for anomaly detection.