October 7th, 2011 • 3 Comments
So DTrace is awesome – You can create nice analytics with it like Joyent does. But what I wanted is to access the output/aggregations from DTrace using Python to be able to parse the output as it comes. Using DTrace to Monitor Python or zones is already easy 🙂 Doing so it might be able to express up to date information to a (Cloud)Client (using of course sth. like OCCI)
So all I need is a Python based DTrace consumer which uses the dtrace library. To start with let’s reading the comments in the file /usr/include/dtrace.h – most notable is:
Note: The contents of this file are private to the implementation of the Solaris system and DTrace subsystem and are subject to change at any time without notice.
So we are already on our own – Next to that there is very limited documentation on writing DTrace consumers. A few quick searches might help you find some information. Probably the most up to date is to look into Bryan Cantrill’s consumer for node.js: https://github.com/bcantrill/node-libdtrace. And as mentioned a Python based consumer for libdtrace should be the goal of all this – so peeking to how others do it is probably a good idea :-P. For now let we will focus on a simple Hello World example.
First we need to understand how to use libdtrace – So let’s take a look at this diagram:

Source: http://www.macosinternals.com/images/stories/DTrace/drace_life_cycle.jpg
Following this life-cycle we can easily create some C code which will interface nicely with libdtrace. But since we can use it in C we can also use Python and ctypes to access the library. Here it is where we start the fun part.
To start with we will try to execute the following D script. It does nothing more than printing Hello World when executed using the dtrace command. But the output of this trace should now be received in Python code – so the output could be evaluated later on:
dtrace:::BEGIN {trace("Hello World");}
Now let’s write some python code – first we need to wrap some Structures which are defined in the dtrace.h file. Namely we will need dtrace_bufdata, dtrace_probedesc, dtrace_probedata and dtrace_recdesc. Since this is a blog post please refer to the source code at github for more details. We also need to define some types for callback functions – since we need a buffered writer, chew and chewrec functions as shown in the previous diagram:
CHEW_FUNC = CFUNCTYPE(c_int,
                      POINTER(dtrace_probedata),
                      POINTER(c_void_p))
CHEWREC_FUNC = CFUNCTYPE(c_int,
                         POINTER(dtrace_probedata),
                         POINTER(dtrace_recdesc),
                         POINTER(c_void_p))
BUFFERED_FUNC = CFUNCTYPE(c_int,
                          POINTER(dtrace_bufdata),
                          POINTER(c_void_p))

def chew_func(data, arg):
    '''
    Callback for chew.
    '''
    print 'cpu :', c_int(data.contents.dtpda_cpu).value
    return 0


def chewrec_func(data, rec, arg):
    '''
    Callback for record chewing.
    '''
    if rec == None:
        return 1
    return 0


def buffered(bufdata, arg):
    '''
    In case dtrace_work is given None as filename - this one is called.
    '''
    print c_char_p(bufdata.contents.dtbda_buffered).value.strip()
    return 0
The function called buffered will eventually write the Hello World string later on – The chew function will print out the CPU id.
With the basic stuff available new can load the libdtrace library and start doing some magic with it:
cdll.LoadLibrary("libdtrace.so")

LIBRARY = CDLL("libdtrace.so")
Now all there is left to do is follow the steps described in the diagram. First step is to get an handle an set some options:
    # get dtrace handle
    handle = LIBRARY.dtrace_open(3, 0, byref(c_int(0)))

    # options
    if LIBRARY.dtrace_setopt(handle, "bufsize", "4m") != 0:
        txt = LIBRARY.dtrace_errmsg(handle, LIBRARY.dtrace_errno(handle))
        raise Exception(c_char_p(txt).value)
Setting the bufsize option is important – otherwise DTrace will report an error. Now we’ll register the buffered function which we wrote in Python and for which we have a ctypes type:
    buf_func = BUFFERED_FUNC(buffered)
    LIBRARY.dtrace_handle_buffered(handle, buf_func, None)
Now we will compile the D script and run it:
    prg = LIBRARY.dtrace_program_strcompile(handle, SCRIPT, 3, 4, 0, None)

    # run
    LIBRARY.dtrace_program_exec(handle, prg, None)
    LIBRARY.dtrace_go(handle)
    LIBRARY.dtrace_stop(handle)
If this exists correctly (The C file in the github repository has all the checks for the return codes in it) we can try to get the Hello World. The chew and chewrec functions are also implemented in Python and can now be registered.
If the second argument on the dtrace_work function is None DTrace will automatically use the buffered callback function described two steps ago. Otherwise a filename needs to be provided – but we wanted to get the Hello World into our Python code:
    # do work
    LIBRARY.dtrace_sleep(handle)
    chew = CHEW_FUNC(chew_func)
    chew_rec = CHEWREC_FUNC(chewrec_func)
    LIBRARY.dtrace_work(handle, None, chew, chew_rec, None)
And last but not least we will print out any errors close the handle on DTrace:
    # Get errors if any...
    txt = LIBRARY.dtrace_errmsg(handle, LIBRARY.dtrace_errno(handle))
    print c_char_p(txt).value

    # Last: close handle!
    LIBRARY.dtrace_close(handle)
Now this all isn’t perfect and not ready at all (especially the naming of functions could be updated, a nice abstraction layer be added, etc) – but it should give a nice overview of how to write DTrace consumers. And for the simple example here both the C and Python code at the previously mentioned github repository do seem to work – and do in fact output:
cpu : 0
Hello World
Error 0
So maybe it’s time to combine pyssf (an OCCI implementation), pyzone (Manage zones using Python) and python-dtrace for monitoring and create a nice ‘dependable’ (Not my idea – these are the words of Andy) something…
Categories: Personal, Work • Tags: DTrace, Python • Permalink for this article
July 6th, 2011 • Comments Off on OpenIndiana zones & DTrace
Let’s assume we want to create a Solaris zone called foo on an OpenIndiana box. This post will walk you to all the steps necessary to bootstrap and configure the zone, so it’s ready to use without any user interaction. Also briefly discussed is how to limit the resources a zone can consume.
7 Steps are included in this mini tutorial:
- Step 1 – Create the zpool for your zones
- Step 2 – Configure the zone
- Step 3 – Sign into the zone
- Step 4 – Delete and unconfigure the zone
- Step 5 – Limit memory
- Step 6 – Use the fair-share scheduler
- Step 7 – Some DTrace fun
Step 1 – Create the zpool for your zones
First a pool is created and mounted to /zones. Deduplication is activated for this pool & a quota is set – so the zone has a space limit of 10Gb.
zfs create -o compression=on rpool/export/zones
zfs set mountpoint=/zones rpool/export/zones
zfs set dedup=on rpool/export/zones

mkdir /zones/foo
chmod 700 /zones/foo

zfs set quota=10g rpool/export/zones/foo
Step 2 – Configure the zone
A zone will be configured the way that it has the IP 192.168.0.160 (Nope – DHCP doesn’t work here :-)) and uses the physical device rum2. Otherwise the configuration is pretty straight forward. (TODO: use crossbow)
zonecfg -z foo "create; set zonepath=/zones/foo; set autoboot=true; \
 add net; set address=192.168.0.160/24; set defrouter=192.168.0.1; set physical=rum2; end; \
 verify; commit"
zoneadm -z foo verify
zoneadm -z foo install
Too ensure that when we boot the zone everything is ready to use without any additional setups, a file called sysidcfg is placed in the /etc of the zone. This will make sure that when we boot all necessary parameters like a root password, the network or the keyboard layout are automatically configured. Also the host’s resolv.conf is copied to the zone (this might not be necessary if you have a properly setup DNS server – than you can configure that DNS server in the sysidcfg file – mine does not know the hostname foo so that is why I do it this way) and the nsswitch.conf file is copied so it’ll use the resolv.conf file. Finally the zone is started…
echo "
name_service=NONE
network_interface=PRIMARY {hostname=foo
                           default_route=192.168.0.1
                           ip_address=192.168.0.160
                           netmask=255.255.255.0
                           protocol_ipv6=no}
root_password=aajfMKNH1hTm2
security_policy=NONE
terminal=xterms
timezone=CET
timeserver=localhost
keyboard=German
nfs4_domain=dynamic
" &> /zones/foo/root/etc/sysidcfg

cp /etc/resolv.conf /zones/foo/root/etc/
cp /zones/foo/root/etc/nsswitch.dns /zones/foo/root/etc/nsswitch.files

zoneadm -z foo boot
To create a password you can use the power of Python – the old way of copying the passwords from /etc/shadow doesn’t work on newer Solaris boxes since the value of CRYPT_DEFAULT is set to 5 in the file /etc/security/crypt.conf:
python -c "import crypt; print crypt.crypt('password', 'aa')"
Step 3 – Sign into the zone
Now zlogin or ssh can be used to access the zone – Note that the commands mpstat and prtconf will show that the zone has the same hardware configuration as the host box (zfs list – will show that disk space is already limited). In the next steps we want to limit those…
Step 4 – Delete and unconfigure the zone
First we will delete the zone foo again:
zoneadm -z foo halt
zoneadm -z foo uninstall
zonecfg -z foo delete
Step 5 – Limit memory
Following the steps above just change the configuration of the zone and add the capped-memory option. In this example it’ll limit the memory available to the zone. When running prtconf it’ll show that the zone only has 512Mb RAM – mpstat will still show all CPUs of your host box.
zonecfg -z foo "create; set zonepath=/zones/foo; set autoboot=true; \
 add net; set address=192.168.0.160/24; set defrouter=192.168.0.1; set physical=rum2; end; \
 add capped-memory; set physical=512m; set swap=512m; end; \
 verify; commit"
Step 6 – Using Resource Pools
While using resources pools it is possible to create a resource pool for a zone which only has one CPU assigned. Use the pooladm command to configure a pool called pool1:
poolcfg -c 'create pset pool1_set (uint pset.min=1 ; uint pset.max=1)'
poolcfg -c 'create pool pool1'
poolcfg -c 'associate pool pool1 (pset pool1_set)'

pooladm -c # writes to /etc/pooladm.conf
To restore the old pool configuration run ‘pooladm -x‘ and ‘pooladm -s‘
Now just configure the zone to use and associate it with the pool:
zonecfg -z foo "create; set zonepath=/zones/foo; set autoboot=true; \
 set pool=pool1; \
 add net; set address=192.168.0.160/24; set defrouter=192.168.0.1; set physical=rum2; end; \
 add capped-memory; set physical=512m; set swap=512m; end; \
 verify; commit"
Running mpstat and prtconf in the zone will show only one CPU and 512Mb RAM.
Step 6 – Use the fair-share scheduler
Also if you have several zones running in one pool you want to modify the pool to use FSS – so a more important zone gets privileged shares:
poolcfg -c 'modify pool pool_default (string pool.scheduler="FSS")'
pooladm -c
priocntl -s -c FSS -i class TS
priocntl -s -c FSS -i pid 1
And during the zone configuration define the rctl option – This example will give the zone 2 shares:
zonecfg -z foo "create; set zonepath=/zones/foo; set autoboot=true; \
 add net; set address=192.168.0.160/24; set defrouter=192.168.0.1; set physical=rum2; end; \
 add capped-memory; set physical=512m; set swap=512m; end; \
 add rctl; set name=zone.cpu-shares; add value (priv=privileged,limit=2,action=none); end; \
 verify; commit"
Step 7 – Some DTrace fun
DTrace can ‘look’ into the zones – For example to let DTrace look at the files which are opened by process within the zone foo you can simply add the predicate ‘zonename == “foo”‘:
pfexec dtrace -n 'syscall::open*:entry / zonename == "foo" / \
  { printf("%s %s",execname,copyinstr(arg0)); }'
I was researching this stuff to create a Python module to configure and bootstrap zones so I can monitor the zones & their previously created SLAs.
Categories: Personal, Work • Tags: DTrace, OpenSolaris, Python, ZFS • Permalink for this article
July 1st, 2011 • Comments Off on Python & DTrace
The following DTrace script can be used to trace Python. It will show you the file, line-number, the time it took to get from the last line to the current one and the (indented) function it is in. This helps understanding the flow of your Python code and can help finding bugs & timing issues. As a little extra it is setup the way that it only shows the files of your code – not the once located in /usr/lib/*. This helps with readability and makes the output more dense since the site-packages are left out.
I now have this running in the background on a second screen whenever I code python. First screen holds my IDE – and next to all the other stuff I do it gives great up-to-date information on the stuff you’re coding. Again proof for the case that coding Python on Solaris is a great idea (Also thanks to DTrace). I know this is simple stuff – but sometimes the simple stuff helps a lot! Now it would only be nice to create a GUI around it 🙂 First the DTrace script is shown; example output is further below…
#pragma D option quiet

self int depth;
self int last;

dtrace:::BEGIN
{
    printf("Tracing... Hit Ctrl-C to end.\n");
    printf(" %-70s %4s %10s : %s %s\n", "FILE", "LINE", "TIME",
           "FUNCTION NAME", "");
}

python*:::function-entry,
python*:::function-return
/ self->last == 0 /
{
    self->last = timestamp;
}

python*:::function-entry
/ dirname(copyinstr(arg0)) <= "/usr/lib/" /
{
    self->delta = (timestamp - self->last) / 1000;
    printf(" %-70s %4i %10i : %*s> %s\n", copyinstr(arg0), arg2, self->delta,
           self->depth, "", copyinstr(arg1));
    self-> depth++;
    self->last = timestamp;
}

python*:::function-return
/ dirname(copyinstr(arg0)) <= "/usr/lib/" /
{
    self->delta = (timestamp - self->last) / 1000;
    self->depth--;
    printf(" %-70s %4i %10i : %*s< %s\n", copyinstr(arg0), arg2, self->delta,
            self->depth, "", copyinstr(arg1));
    self->last = timestamp;
}
Example output:
 $ pfexec dtrace -s misc/py_trace.d
Tracing... Hit Ctrl-C to end.
 FILE                                                                   LINE       TIME : FUNCTION NAME
[...]
 /home/tmetsch/data/workspace/pyssf/occi/service.py                      144       1380 : > put
 /home/tmetsch/data/workspace/pyssf/occi/service.py                      184         13 :  > parse_incoming
 /home/tmetsch/data/workspace/pyssf/occi/service.py                       47          9 :   > extract_http_data
 /home/tmetsch/data/workspace/pyssf/occi/service.py                       68         39 :   < extract_http_data
 /home/tmetsch/data/workspace/pyssf/occi/service.py                       70         10 :   > get_parser
 /home/tmetsch/data/workspace/pyssf/occi/registry.py                      60         36 :    > get_parser
 /home/tmetsch/data/workspace/pyssf/occi/registry.py                      83         12 :    < get_parser
 /home/tmetsch/data/workspace/pyssf/occi/service.py                       77          8 :   < get_parser
 /home/tmetsch/data/workspace/pyssf/occi/protocol/rendering.py            99         11 :   > to_entity
 /home/tmetsch/data/workspace/pyssf/occi/protocol/rendering.py            81         10 :    > extract_data
 /home/tmetsch/data/workspace/pyssf/occi/protocol/rendering.py            37         11 :     > __init__
 /home/tmetsch/data/workspace/pyssf/occi/protocol/rendering.py            41         11 :     < __init__
 /home/tmetsch/data/workspace/pyssf/occi/protocol/rendering.py            97         14 :    < extract_data
[...]
This was inspired by the py_flowtime.d script written by Brendan Gregg.
Categories: Personal, Work • Tags: DTrace, OpenSolaris, Python • Permalink for this article
June 16th, 2011 • Comments Off on The Power of Python & Solaris
Here is a presentation I gave today to demo the power of Python and Solaris. It’s about creating a fictitious service similar to no.de or Google App Engine but with Python & Solaris. Warning: contains OCCI and DTrace!
Categories: Personal • Tags: DTrace, OCCI, OpenSolaris, Python • Permalink for this article
April 2nd, 2011 • Comments Off on Fun with Joyent’s Node.js cloud analytics
Since Joyent release their no.de service I wanted to give it a try. Especially since they added an analytic feature based on DTrace which is described in all details here: Joyent’s wiki. Also nice is this blog post.
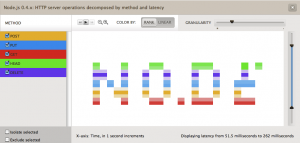
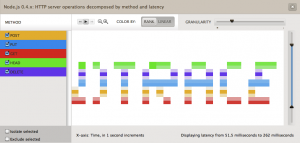
So I was tempted to play around with both for a while now. Finally I came up with the idea of drawing words in the analytics panel of the no.de service. Just like a stock exchange ticker with some scrolling test.
So I wrote a simple server.js which responses to different HTTP method (POST, PUT, GET, DELETE, HEAD) request with different latencies. I created an instrumentation in the cloud analytics panel of the no.de service for HTTP server operations (method) over latency. Now only thing left was to write some python code to execute concurrent HTTP requests using different HTTP methods. So 5 concurrent requests with HTTP GET, POST, PUT, DELETE and HEAD would result in vertical 5 dots. 3 concurrent request with HTTP HEAD, PUT and GET in 3 vertical dots with some space between them. I guess you get the picture.
Here are some screenshots:


Hardest part was to figure out the right values for the latencies. Took a while to figure out those who printed the nicest characters without too many ‘drawing erros’.
Categories: Personal • Tags: Analytics, DTrace, Joyent, Python • Permalink for this article


