Fun with Joyent’s Node.js cloud analytics
April 2nd, 2011 • Comments Off on Fun with Joyent’s Node.js cloud analyticsSince Joyent release their no.de service I wanted to give it a try. Especially since they added an analytic feature based on DTrace which is described in all details here: Joyent’s wiki. Also nice is this blog post.
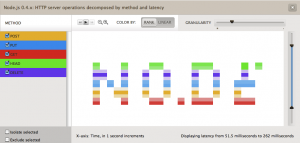
So I was tempted to play around with both for a while now. Finally I came up with the idea of drawing words in the analytics panel of the no.de service. Just like a stock exchange ticker with some scrolling test.
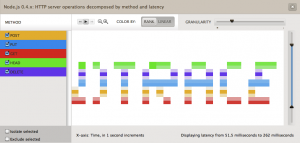
So I wrote a simple server.js which responses to different HTTP method (POST, PUT, GET, DELETE, HEAD) request with different latencies. I created an instrumentation in the cloud analytics panel of the no.de service for HTTP server operations (method) over latency. Now only thing left was to write some python code to execute concurrent HTTP requests using different HTTP methods. So 5 concurrent requests with HTTP GET, POST, PUT, DELETE and HEAD would result in vertical 5 dots. 3 concurrent request with HTTP HEAD, PUT and GET in 3 vertical dots with some space between them. I guess you get the picture.
Here are some screenshots:
Hardest part was to figure out the right values for the latencies. Took a while to figure out those who printed the nicest characters without too many ‘drawing erros’.


