July 21st, 2025 • Comments Off on Preference-driven systems: a practical bridge to intent-driven systems
Intent-driven orchestration has emerged as a effective model for managing increasingly complex, distributed systems. Rather than prescribing how infrastructure should behave, intent allows users to declare what outcomes or objectives they want systems to fulfill. This paradigm shifts control from static configurations to adaptive, context-aware orchestration. Examples of such approaches are already available, such as Intel’s Intent-Driven Orchestration planner for Kubernetes or TM Forum’s intent ontology, which provide a structured way to express high-level business and service goals that can be interpreted by autonomous systems.
Intent-driven systems offer several advantages and can be effectively combined with declarative orchestration and management approaches. These models are not mutually exclusive — in fact, when used together, they can deliver the best of both worlds: clear goal expression and programmable control. Here’s why intents are particularly powerful (adapted from this blog post):
- Semantic Portability: Intents define what needs to be achieved (e.g., “ensure 10ms tail latency”), not how to achieve it (e.g., “allocate 10 vCPUs”). This abstraction enables portability across heterogeneous platforms. While infrastructure may vary, the meaning of the intent — such as latency targets — remains consistent.
- Intent as Invariant: Because intents focus on outcomes rather than implementation, resource providers have the freedom to optimize — change hardware, reconfigure topology, shift workloads — as long as they uphold the declared expectations. This flexibility supports resilience and continuous optimization.
- Context-Aware Optimization: Intents offer (e.g., “favor performance over power consumption”) gives orchestrators crucial context. This enables systems to make informed trade-offs, and take decisions to better align with user objectives.
It’s a powerful vision — and arguably the north star for upcoming orchestration and management systems. However, realizing it at scale remains a challenge.
The Reality of Interface Inertia
Intent requires shared semantics between users and resource providers. These semantics must be embedded in APIs, orchestration layers, and policy engines — all of which take time to evolve and gain adoption. In many systems today, APIs are still tightly coupled to implementation details. Even where abstraction exists, it often lacks the richness to fully express intent in a way that systems can reliably act on.
As a result, adoption of intent-based orchestration has been slower than hoped. Infrastructure providers need time to align on standards, support new interfaces, and re-architect parts of their platforms. Application owners, meanwhile, still operate in environments where procedural configurations are the norm.
A Middle Ground: Preference-Driven Orchestration
As an interim step, a preference-driven orchestration model offers a practical path forward.
Rather than fully declaring objectives and invariants, users can express preferences — high-level hints about how orchestration decisions should be made. These preferences are not strict requirements, but they provide meaningful guidance to the orchestration layer.
Examples of such preferences might include:
- “Prefer performance over energy efficiency”
- “Minimize cost where possible”
- “Favor locality to user region”
- “No need to boost this best effort app”
- “This is a <important|besteffort|background, …> task”
These could be defined as simple profiles, annotations, or lightweight policy templates. Unlike full intent, preferences don’t require formal semantics or guaranteed enforcement — they simply steer the system toward user-aligned decisions in environments where exact guarantees are not yet feasible.
Why Preferences Matter
- Feasible Today: Preferences can be layered onto existing APIs and orchestrators with minimal disruption, making them more readily adoptable.
- Low Risk, High Value: Because preferences are advisory rather than declarative, they don’t require full support from every system component. Partial adherence still improves system alignment with user goals.
- Prepares the Ground for Intent: By introducing users to higher-level abstractions and aligning systems with those abstractions incrementally, preferences create a pathway toward more formal intent expression over time.
Improves Portability and Contextualization: Even when resource providers cannot guarantee intent satisfaction, understanding user preferences provides valuable context for optimizing placement, configuration, and trade-off decisions.
From Preferences to Intent
Over time, preference-driven orchestration can evolve naturally into full intent-driven models. As infrastructure layers mature and standard semantics emerge, preferences can be promoted to soft intents, and eventually to hard objectives with measurable enforcement.
This progression mirrors other transitions in computing — from imperative to declarative configuration, from manual scaling to autoscaling, from static placement to adaptive scheduling. Each step builds on the last, gradually shifting the responsibility from the user to the system.
Intent-driven orchestration remains a powerful vision for the future of cloud, edge, and distributed computing. But recognizing the complexity of reaching that goal, a preference-driven approach offers a practical, incremental step. By enabling systems to make smarter decisions today — with minimal disruption — preferences pave the way for a more intelligent, adaptive, and user-aligned orchestration model tomorrow.
Categories: Personal • Tags: Intent-Driven Orchestration, Orchestration • Permalink for this article
December 12th, 2022 • Comments Off on Intent Driven Orchestration
So let’s start with a bolt statement: the introduction of Microservices/functions and Serverless deployment styles for cloud-native applications has triggered a need to shift the orchestration paradigms towards an intent-driven model.
So what are intents – and what does intent-driven mean? Imagine a restaurant and you order a medium rare steak – the “medium rare” part is the intent declaration. But if we contrast this concept to how orchestration stacks work today – you’d walk into the restaurant, walk straight into the kitchen and you’d say “put the burner on 80% and use that spatula” etc. Essentially declaratively asking for certain amounts of resources/certain way of setup. And obviously, there are a couple of issues with that – you do not necessarily know all the details of the burner. Should it have been set to 80% or 75% maybe? Should it have been 1 core, 500Mb or RAM, sth else? Abstractions and Serverless, anyone?
So why not let app/service owners define what they care about – the objectives of their app/service? For example, “I want P99 latency to be less than 20ms”. That is the “medium rare” intent declaration for an app/service. That is what we’ve been working on here at Intel – and now we’ve released our Intent-Driven Orchestration Planner (Github) for Kubernetes.
Btw.: I shamelessly stole the restaurant metaphor from Kelsey Hightower – for example, check out this podcast. On the P-numbers – again sth that other people have been writing about as well, see Tim Bray‘s blog post on Serverless (part of a Series).
Based on the intents defined by the service owner we want the orchestration stack to handle the rest – just like a good chef. We can do this through scheduling (where/when to place) and planning (how/what to do), to figure out how to set up the stack to make sure the objectives (SLOs) are met.
So why though a planner? The planning component brings sth to the table that the scheduler cannot. It continuously tries to match desired and current objectives of all the workloads. It does this based on data coming from the observability/monitoring stack and tries to reason to enable efficient management. In doing so it can trade-off between various motivations for the stakeholders at play and even take proactive actions if needed – the possibilities for a planner are huge. In the end, the planner can e.g. modify POD specs so the scheduler can make more informed decisions.
Here is an example of that an intent declaration for out Intent Driven Orchestration Planner can look like – essentially requesting that P99 latency should be below 20ms for a target Kubernetes Deployment:
apiVersion: "ido.intel.com/v1alpha1"
kind: Intent
metadata:
  name: my-function-intent
spec:
  targetRef:
    kind: "Deployment"
    name: "default/function-deployment"
  objectives:
    - name: my-function-p99compliance
      value: 20
      measuredBy: default/p99latency
Again the usage of planners is not revolutionary per se, NASA has even flown them to space – and could demonstrate some nice self-healing capabilities – on e.g. Deep Space 1. And just as Deep Space 1 was a tech demonstrator, maybe a quick note: this is all early days for intent-driven orchestration, but we would be very interested in learning what you think…
So ultimately, by better understanding the intents of the apps/services instead of just their desired declarative state, orchestrators – thanks to an intent-driven model – can make decisions that will lead to efficiency gains for service and resource owners.
Categories: Personal • Tags: Cloud, Edge, Intent-Driven Orchestration, Orchestration, Planning • Permalink for this article
December 27th, 2018 • Comments Off on Tracing your functions
Note: this is mostly just for proof of concept – not necessarily something you want to do in a production system, but might be useful in a staging/test environment.
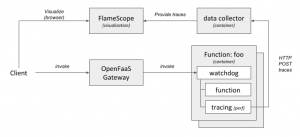
Functions in a Serverless environment (Tim Bray has a nice write-up of some of the key aspects of Serverless here. And let’s leave aside some side notes like this one.) like OpenFaaS or OpenWhisk are short lived things that really come and go. But wouldn’t it be useful to – regardless of this context – to be able to gain insight on how your functions perform? Hence being able to trace/profile the functions in an environment would be a nice to have add-on.
The following diagram shows a high-level overview of how this could look like.
 (Click to enlarge)
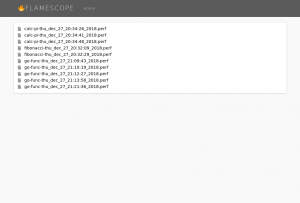
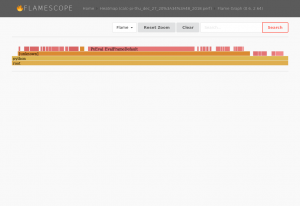
Once you have the tracing/profiling of your functions in place FlameScope is a handy tool to visualize them. Here you can see the list of trace for previously executed functions:
 (Click to enlarge)
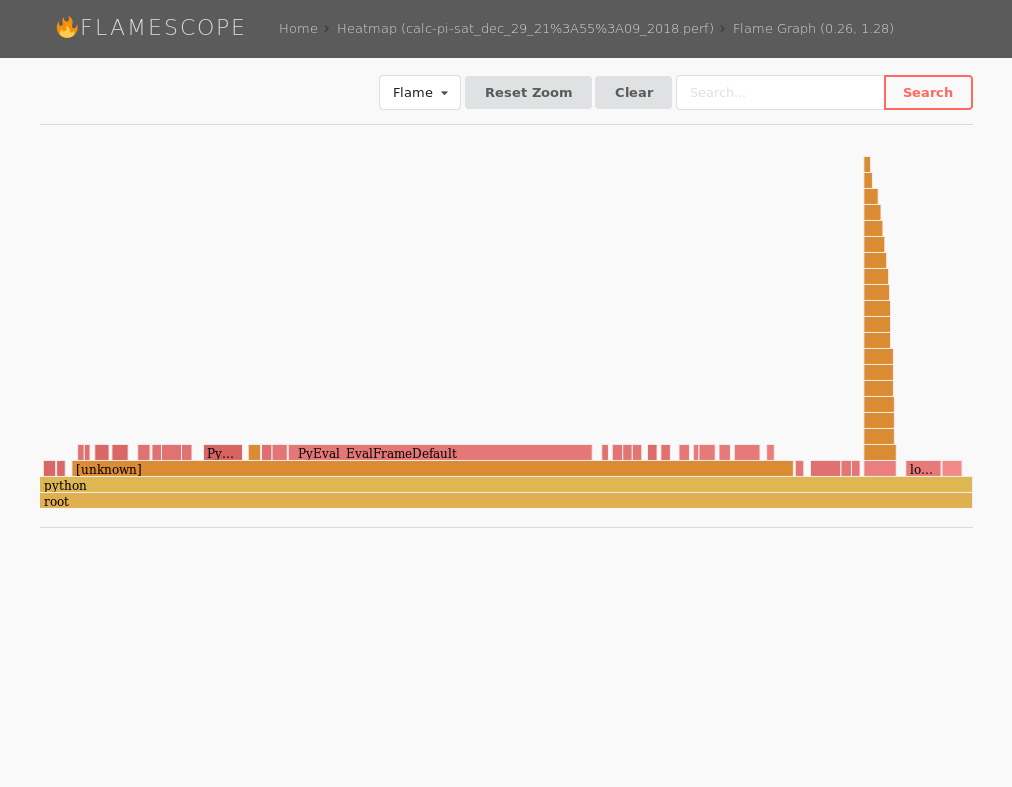
Drilling deeper into them you can see the actually FlameGraphs of each function – for example a function calculating pi.
 (Click to enlarge)
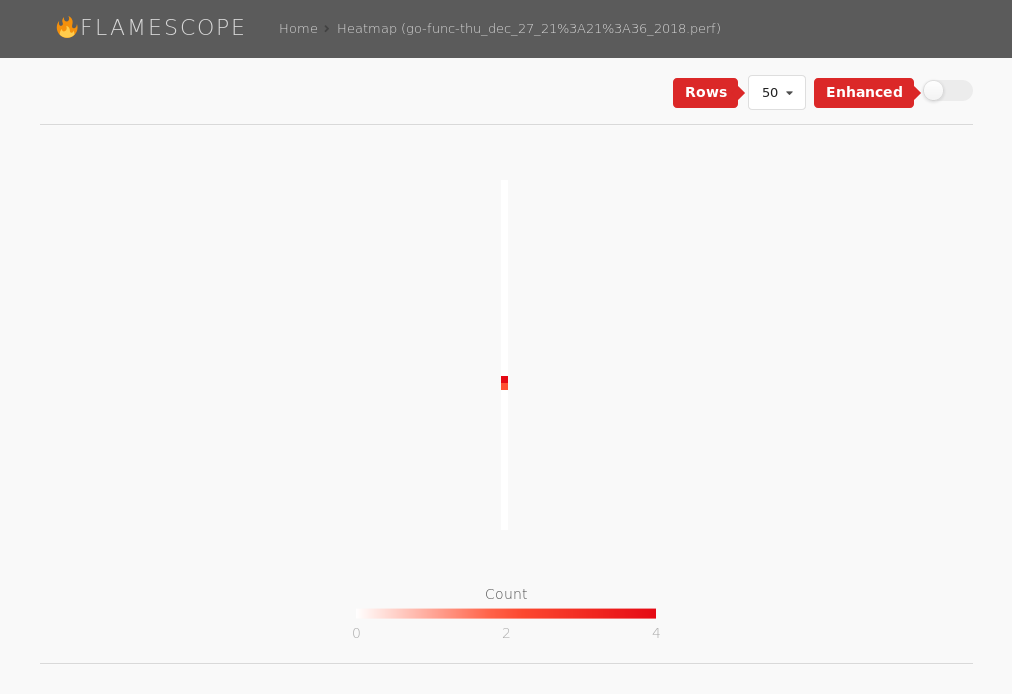
As some functions have a very short lifespan, you will also note – that by looking at the heatmaps – not a lot is going:
 (Click to enlarge)
I’m not necessarily claiming this is all very useful – especially since some functions are still very short lived, and their traces are not capturing a lot of information, therefore. However the general concept of all this sounds intriguing to me. Running your function on different platforms for example will results in difference in the FlameGraph. The function shown here will calculate Pi and perform some I/O operations for test purposes. The function’s FlameGraph from above looks a bit different when run on a different platform (Xeon vs i5):
 (Click to enlarge)
Multiple runs of the same function on the same platform will results in similar FlameGraphs.
The following sections describe how to enable such a scenario:
Step 1) enabling the environment
Frameworks such as OpenFaas or OpenWhisk will use docker [cold|warm|hot] containers to host the functions. So one of the initial steps it to enable tracing in those containers. By one some syscalls are blocked – for good reason – in docker [src]. Unless you want to go dig deep into OpenFaaS or OpenWhisk and change how they run containers, the easiest way forward it to enable e.g. the perf_event_open system call using seccomp security profiles system wide. To do so start dockerd with the following parameters:
$ sudo dockerd -H unix:///var/run/docker.sock --seccomp-profile /etc/docker/defaults.json
An example security profile can be found here. Just whitelist the right system calls that you will need and store the profile in /etc/docker/defaults.json. For this example we will user perf, hence we need to enable perf_event_open.
Note: another option (almost more elegant & more secure) would be to trace the functions not from within the container, but on the host system. perf does allow for limiting the cgroup and hence doing this (through the option –cgroup=docker/…) , but this would yet again require some more integration work with your framework. Also note that although perf does not add a lot of overhead for instrumentation, it also does not come “for free” either.
Step 2) plumbing
As we will trace the functions from within their containers, we need to get the data out of the containers. A simple python HTTP service that allows for POSTing traces to it, will also store the same into files in a directory. As this service can be run in a container itself, this directory can easily be mounted to the container. Now within each container we can simply post the data (in the file trace.perf) to the data collector:
$ curl -X POST http://172.17.0.1:9876/ -H 'X-name: go-func' --data-binary @trace.perf
Step 3) altering the templates
The easiest way to kick of the tracing command perf, whenever a function is executed is by altering the template of your framework. For OpenFaaS your can easily pull the templatest using:
$ faas-cli template pull
Once they have been pulled the easiest thing to do is to alter the Dockerfile to include a shell script which executes e.g. your perf commands:
#!/bin/sh

perf record -o perf.data -q -F 1004 -p $1 -a -g -- sleep 5
perf script -i perf.data --header > trace.perf
curl -X POST http://172.17.0.1:9876/ -H 'X-name: fibonacci' --data-binary @trace.perf
Note that in this example we use perf to instrument at a frequency of 1004 Hz – just offsetting it from 1000 Hz to make sure we capture everything. It might make sense to tweak the frequency according to your environment – 1000 Hz is already providing a lot of detail.
Also we need to alter the Dockerfiles to a) install the perf tool and b) ensure we can execute it with the user app:
...
RUN apk add curl sudo
RUN  apk add linux-tools --update-cache --repository http://dl-3.alpinelinux.org/alpine/edge/testing/ --allow-untrusted

# Add non root user
RUN addgroup -S app && adduser app -S -G app wheel
RUN adduser app wheel
RUN echo '%app ALL=(ALL) NOPASSWD:ALL' >> /etc/sudoers

WORKDIR /home/app/

# ensure we copy the trace file over as well.
COPY trace.sh           .
...
Also make sure that this shell script will get call whenever your function is triggered. For example in the python templates alter the index.py file, for e.g. golang edit the main.go file. Within those just execute the shell script above with the PID of the current process as the first argument
Step 4) visualize it
FlameGraphs are pretty handy, and a team @ Netflix (including Brendan Gregg) have been busy writing a handy tool to visualize the traces. FlameScope can easily be executed using a docker command:
$ docker run --rm -it -v /tmp/stacks:/stacks:ro -p 5000:5000 flamescope
Note: that I had to do some minor tweaks to get FlameScope to work. I had to update the Dockerfile to the python3 version of alpine, manually add libmagic (apk add libmagic), and don’t forget to configure FlameScope to pickup the profiles from /stacks in config.py.
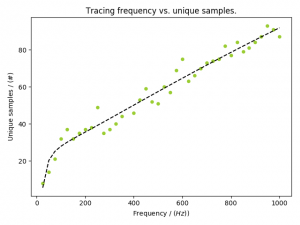
Update [2019/01/08] Originally I traced the functions with a frequency of 1004 Hz. This seems to be a bit high. As you can see in the following graph – and read this as a rule of thumb, not necessarily the ground truth – sampling at about 200 Hz will give you the necessary information:
 (Click to enlarge)
Categories: Personal • Tags: FaaS, Instrumentation, Orchestration, Serverless • Permalink for this article
November 12th, 2017 • Comments Off on Controlling a Mesos Framework
Note: This is purely for fun, and only representing early results.
It is possible to combine more traditional scheduling and resource managers like OpenLava with DCOS like Mesos [1]. The basic implementation which glues OpenLava and Mesos together is very simple: as long as jobs are in the queue(s) of the HPC/HTC scheduler it will try to consume offers presented by Mesos to run these jobs on. There is a minor issue with that however: the framework is very greedy, and will consume a lot of offers from Mesos (So be aware to set quotas etc.).
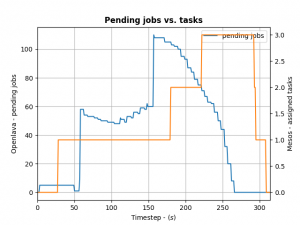
To control how many offers/tasks the Framework needs to dispatch the jobs in the queue of the HPC/HTC scheduler we can use a simple PID controller. By applying a bit of control we can tame the framework as the following the diagram shows:
(Click to enlarge)
We define the ratio between running and pending jobs as a possible target or the controller (Accounting for a division by zero). Given this, we can set the PID controller to try to keep the system at the ratio of e.g. 0.3 as a target (semi-randomly picked).
For example: if 10 jobs are running, while 100 are in the queue pending, the ratio will be 0.1 and we need to take more resource offers from Mesos. More offers, means more resources available for the jobs in the queues – so the number of running jobs will increase. Let’s assume a stable number of jobs in the queue, so e.g. the system will now be running 30 jobs and 100 jobs are in the queue. This represent the steady state and the system is happy. If the number of jobs in the queues decreases the system will need less resources to process them. For example 30 jobs are running, while 50 are pending gives us a ratio of 0.6. As this is a higher ratio than the specified target, the system will decrease the number of tasks needed from Mesos.
This approach is very agnostic to job execution times too. Long running jobs will lead to more jobs in the queue (as they are blocking resources) and hence decreasing the ratio, leading to the framework picking up more offers. Short running jobs will lead to the number of pending jobs decreasing faster and hence a higher ratio, which in turn will lead to the framework disregarding resources offered to it.
And all the magic is happening very few lines of code running in a thread:
def run(self):
    while not self.done:
        error = self.target - self.current  # target = 0.3, self.current == ratio from last step
        goal = self.pid_ctrl.step(error)  # call the PID controller
        self.current, pending = self.scheduler.get_current()  # get current ratio from the scheduler
        self.scheduler.goal = max(0, int(goal))  # set the new goal of # of needed tasks.
        time.sleep(1)
The PID controller itself is super basic:
class PIDController(object):
    """
    Simple PID controller.
    """

    def __init__(self, prop_gain, int_gain, dev_gain, delta_t=1):
        # P/I/D gains
        self.prop_gain = prop_gain
        self.int_gain = int_gain
        self.dev_gain = dev_gain

        self.delta_t = delta_t

        self.i = 0
        self.d = 0
        self.prev = 0

    def step(self, error):
        """
        Do some work & progress.
        """
        self.i += self.delta_t * error
        self.d = (error - self.prev) / self.delta_t
        self.prev = error

        tmp = \
            self.prop_gain * error + \
            self.int_gain * self.i + \
            self.dev_gain * self.d
        return tmp
I can recommend the following book on control theory btw: Feedback Control for Computer Systems.
Categories: Personal • Tags: Control Theory, LSF, Orchestration, Scheduling • Permalink for this article
January 7th, 2017 • Comments Off on Example 2: Intelligent Orchestration & Scheduling with OpenLava
This is the second post in a series (the first post can be found here) about how to insert smarts into a resource manager. So let’s look how a job scheduler or distributed resource management system (DRMS) — in a HPC use case — with OpenLava can be used. For the rationale behind all this check the background section of the last post.
The basic principle about this particular example is simple: each host in a cluster will report a “rank”; the rank will be used to make a decision on where to place a job. The rank could be defined as: a rank is high when the sub-systems of the hosts are heavily used; and the rank is low when none or some sub-system are utilized. How the individual sub-systems usage influences the rank value, is something that can be machine learned.
Let’s assume the OpenLava managed cluster is up and running and a couple of hosts are available. The concept of elims can be used to get the job done. The first step is, to teach the system what the rank is. This is done in the lsf.shared configuration file. The rank is defined to be a numeric value which will be updated every 10 seconds (while not increasing):
Begin Resource
RESOURCENAME  TYPE    INTERVAL INCREASING  DESCRIPTION
   ...
   rank       Numeric 10       N           (A rank for this host.)
End Resource
Next OpenLava needs to know for which hosts this rank should be determined. This is done through a concept of ‘resource mapping’ in the lsf.cluster.* configuration file. For now the rank should be used for all hosts by default:
Begin ResourceMap
RESOURCENAME LOCATION
rank ([default])
End ResourceMap
Next an external load information manager (LIM) script which will report the rank to OpenLava needs to be written. OpenLava expects that the script writes to stdout with the following format: <number of resources to report on> <first resource name> <first resource value> <second resource name> <second resource value> … . So in this case it should spit out ‘1 rank 42.0‘ every 10 seconds. The following python script will do just this – place this script in the file elim in $LSF_SERVERDIR:
#!/usr/bin/python2.7 -u

import time

INTERVAL = 10


def _calc_rank():
    # TODO calc value here...
    return {'rank': value}

while True:
    RES = _calc_rank()
    TMP = [k + ' ' + str(v) for k, v in RES.items()]
    print(\"%s %s\" % (len(RES), ' '.join(TMP)))
    time.sleep(INTERVAL)
Now a special job queue in the lsb.queues configuration file can be used which makes use of the rank. See the RES_REQ parameter in which it is defined that the candidate hosts for a job request are ordered by the rank:
Begin Queue
QUEUE_NAME = special
DESCRIPTION = Special queue using the rank coming from the elim.
RES_REQ = order[rank]
End Queue
Submitting a job to this queue is as easy as: bsub -q special sleep 1000. Or the rank can be passed along as a resource requirements on job submission (for any other queue): bsub -R “order[-rank]” -q special sleep 1000. By adding the ‘-‘ it is said that the submitter request the candidate hosts to be sorted for hosts with a high rank first.
Let’s assume a couple of hosts are up & running and they have different ranks (see the last column):
openlava@242e2f1f935a:/tmp$ lsload -l
HOST_NAME               status  r15s   r1m  r15m   ut    pg    io  ls    it   tmp   swp   mem   rank
45cf955541cf                ok   0.2   0.2   0.3   2%   0.0     0   0 2e+08  159G   16G   11G    9.0
b7245f8e6d0d                ok   0.2   0.2   0.3   2%   0.0     0   0 2e+08  159G   16G   11G    8.0
242e2f1f935a                ok   0.2   0.2   0.3   3%   0.0     0   0 2e+08  159G   16G   11G   98.0
When checking the earlier submitted job, the execution host (EXEC_HOST) is indeed the hosts with the lowest rank as expected:
openlava@242e2f1f935a:/tmp$ bjobs
JOBID   USER    STAT  QUEUE      FROM_HOST   EXEC_HOST   JOB_NAME   SUBMIT_TIME
101     openlav RUN   special    242e2f1f935 b7245f8e6d0 sleep 1000 Jan  7 10:06
The rank can also be seen in web interface like the one available for the OpenLava Mesos framework. What was described in this post is obviously just an example – other methods to integrate your smarts into the OpenLava resource manager can be realized as well.
Categories: Personal • Tags: LSF, Orchestration, Scheduling, SDI • Permalink for this article