Live football game analysis
December 23rd, 2013 • Comments Off on Live football game analysisNote: I’m talking about American Football here 🙂
In previous posts I already showed how game statistics can be used to automatically which Wide receiver is the Qb’s favorite on which play, down and field position. Now let’s take this one step further and create a little system (using Suricate) which will make suggestions to a Defense Coordinator.
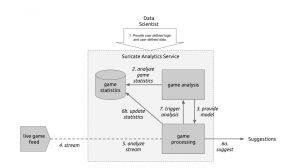
The following diagram will guide through the steps needed to create such a system:
Let’s start at the top. (Step 1) The User of Suricate will start with performing some simple steps. First a bunch of game statistics are uploaded (same as using in this post). Next also a stream is defined. In this case a URI for an AMQP broker (using CloudAMQP – RabbitMQ as a Service) is defined in the service. With this used defined data is provide to the service.
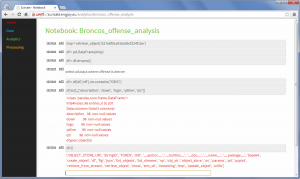
(Step 2) Now we start creating an analytics notebook. Suricate provides an interactive python console via your web browser which can easily be used to explore the data previously uploaded. Python Pandas and scikit-learn are both available within the Suricate service and can be used right away to accomplish this task:
Based on the data we can create a model which describes on which down, on which fieldposition a run or a pass play is performed. We can also store who is the favorite Wide receiver/Running back for those plays (see also). All this information is stored in a JSON data structure and saved using the SDK of Suricate (Step 3).
(Step 4) Now a little external python script needs to be written which grabs relatively ‘live’ game data from e.g. here. This script now simple continuously sends messages to the previously defined RabbitMQ broker. The messages contain the current play, fieldposition and distance togo information.
(Step 5) Now a processing python notebook needs to be written. This is a rather simple python script. It takes the new incoming messages and compares them to the model learned in step 2 & 3. Based on that suggestions can be displayed (Step 6a) – “e.g. watch out for Wes Welker on 3rd and long at own 20y line” or just some percentages for pass or run plays:
Next the information about the new play can be added to the game statics data file (Step 6b). Once this is done a new model can be created (Step 7) to get the most up to date models all the time.
With this overall system new incoming data is streamed in (continuous analytics), models updated and suggestions for a Defense Coordinator outputted. Disclaimer: some steps describe here are not yet in the github repository of suricate – most namely the continuously running of scripts.


