May 20th, 2012 • 3 Comments
In previous blogposts I already demoed what a Python based DTrace consumer can be used for: live inspection (callgraphs) of running programs, nice Visualizations or just plain tracing. Especially with SmartOS (as one of the many platforms which have DTrace support)I found it a bit annoying to deal with DTrace. Since SmartOS is headless itself I was thinking about creating a web based editor for DTrace scripts which would than create nice visualizations of the aggregated data. This simple IDE is written as an Django application and makes use of the Python based DTrace consumer.
So here it is a first shot of the DTrace web based Mini-IDE (couldn’t come up with a better name :-))
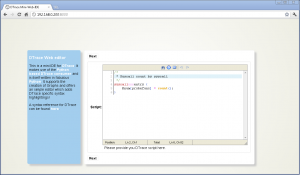
web based DTrace IDE (Click to enlarge)
As you can see it is running inside of Chrome on a Windows box – just to make sure you believe it is indeed web based. Now let’s take a look at all the features:
Syntax highlighting & Error detection
The user is guide through 3 steps – Writing the DTrace script, running it and then the output is shown. The editor in the first step features a DTrace specific syntax highlighting. Variables, Build-in variables, functions, aggregation functions and a set of providers are highlighted accordingly. Comments are also parsed in a certain color.
Next to this the editor will try to compile the script and show possible errors. The following screen-shot shows that when an unknown aggregation function is used the error is reported. It will use the Python binding for libdtrace to compile the script and return any errors:
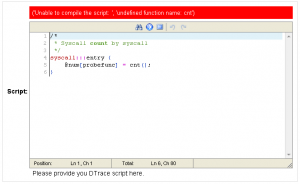
Wrong aggregation function name (Click to enlarge)
Running DTrace
When clicking next to reach the next step a set of options are shown. The user can insert the time in seconds which DTrace should aggregate data (In this case 2 – or 0 when continuously aggregate data) and check if a chart should be generated from the aggregated data:
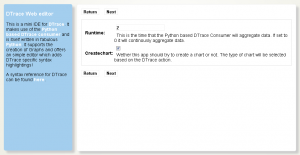
Options for running DTrace (Click to enlarge)
Displaying the result
When done the aggregated Data will be displayed. E.g. when you used the following one liner (syscall count by syscall):
syscall:::entry {
    @num[probefunc] = count();
}
The result is displayed as a pie chart:
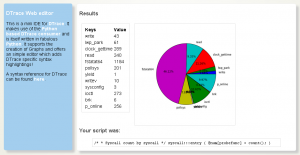
(Click to enlarge)
Or to give another example (A read distribution):
syscall::read:entry {
    @dist[execname] = lquantize(arg0, 0, 12, 2);
}
The result would be a bit different since the aggregation function lquantize is used. The data is displayed from 0 to 12 in steps of 2. The Z-Axis shows the name of the executable:
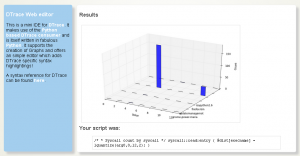
(Click to enlarge)
Categories: Personal • Tags: Analytics, DTrace, Python • Permalink for this article
April 1st, 2012 • Comments Off on Python DTrace consumer and AMQP
This blog post will lead through an very simple example to show how you can use the Python DTrace consumer and AMQP.
The scenario for this example is pretty simple – let’s say you want to trace data on one machine and display it on another. Still the data should be up to date – so basically whenever a DTrace probe fires the data should be transmitted to the other hosts. This can be done with AMQP.
The examples here assume you have a RabbitMQ server running and have pika installed.
Within this example two Python scripts are involved. One for sending data (send.py) and one for receiving (receive.py). The send.py script will launch the DTrace consumer and gather data for 5 seconds:
thr = dtrace.DTraceConsumerThread(SCRIPT, walk_func=walk)
thr.start()
time.sleep(5)
thr.stop()
thr.join()
The DTrace consumer is given an callback function which will be called whenever the DTrace probes fire. Within this callback we are going to create a message ad pass it on to the AMQP broker:
def walk(id, key, value):
    channel.basic_publish(exchange='', routing_key='dtrace', body=str({key[0]: value}))
The channel has previously been initialized (See this tutorial on more details). Now AMQP messages are passed around with up-to-date information from DTrace. All that there is left is implementing a ‘receiver’ in receive.py. This is again straight forward and also works using a callback function:
def callback(ch, method, properties, body):
    print 'Received: ', data

if __name__ == '__main__':
    channel.basic_consume(callback, queue='dtrace', no_ack=True)
    try:
        channel.start_consuming()
    except KeyboardInterrupt:
        connection.close()
Start the receive.py Python script first. Than start the send.py Python script. You can even start multiple send.py scripts on multiple hosts to get an overall view of the system calls made by processes on all machines 🙂
The send.py script counts system calls and will send AMQP messages as new data arrives. You will see in the output of the receive.py script that data arrives almost instantly:
$ ./receive.py
Received:  python 264
Received:  wnck-applet 5
Received:  metacity 6
Received:  gnome-panel 15
[...]
Now you can build life updating visualizations of the data gathered by DTrace.
Categories: Personal • Tags: Analytics, DTrace, Python • Permalink for this article
March 29th, 2012 • Comments Off on Python DTrace consumer meets the web
I had look at my Python DTrace consumer yesterday night and realized it need a bit an overhaul. I already demoed that you can make some visualization with it – like life updating callgraphs etc. Still it missed some basic functionality. For example I did only support some DTrace aggregation actions like sum, min, max and count. Now I added support for avg, quantize and lquantize.
Now I just needed to write about 50 LOC to do something nice 🙂 Those ~50 lines are the implementation of an WSGI app using Mako as a template engine. Embedded in the Mako templates are Google Charts. And those charts actually show information coming out of the Python consumer. Now all what is left, is to point my browser to my SmartOS machine and get up-to-date graphs! For example a piechart which shows system calls by process:

Click to enlarge
Or using quantize I can browse a nice read size distribution – aka: how much bytes do my processes usual read?:

Click to enlarge
With all this it is also possible to plot graphs on the latency of node.js apps :-):

Click to enlarge
Again documentation on writing DTrace consumers is almost non-existent. But with some ‘inspiration’ from Bryan Cantrill and the original C based consumer I was able to get it work.
Categories: Personal • Tags: Analytics, DTrace, Python, SmartOS • Permalink for this article
March 23rd, 2012 • Comments Off on Python DTrace consumer on SmartOS
As mentioned in previous blog posts (1 2 3) I wrote a Python DTrace consumer a while ago. The cool thing is that you can now trace Python (as provider) and consumer the ‘aggregate’ in Python (as consumer) as well :-). Some screen-shots and suggestions what you can do with it are described on the github page.
I did not have much spare time lately but I got the a chance last night to test my Python based DTrace consumer on SmartOS, Solaris 11 and OpenIndiana – and can confirm that it runs on all 3.
To get it up and running on SmartOS you will first need to install some dependencies. Use the 3rd party repositories as described in the SmartOS wiki to get pkg up and running:
pkg install git gcc-44 setuptools-26 gnu-binutils
When that is done we will clone the consumer code and install cython (you could however also use ctypes) using pip:
easy_install pip
pip install cython
git clone git://github.com/tmetsch/python-dtrace.git
cd python-dtrace/
python setup.py install
Now since this is done we can do the obligatory ‘Hello World’ to get things going:

Python DTrace consumer on SmartOS (Click to enlarge)
For more examples refer to the examples folder within the python-dtrace repository.
Categories: Personal • Tags: DTrace, Python, SmartOS • Permalink for this article
February 3rd, 2012 • 1 Comment
I’ve been playing around with OpenShift for the past hour. More specifically OpenShift Express which allows you to quickly develop apps Java, Ruby, PHP, Perl and Python and run them in the ‘Cloud’.
As a first exercise I wanted to check that I was able to get a simple Task board up and running. A good tutorial to create such a simple application with Pyramid can be found here.
After signing into OpenShift you can create a new application in the dashboard. Make sure that before doing so you have your namespace setup and your public ssh key configured in OpenShift. After creating the application a git repository is created for you. Simple clone this so you have a local working copy on your machine.
Now have a look inside you local working copy. You will find the directories data, libs, wsgi and some files like a README and the python setuptools related setup.py. Let’s start with editing the setup.py file:
from setuptools import setup

setup(name='A simple TODO Application to test OpenShift Features.',
      version='1.0',
      description='An OpenShift App',
      author='Thijs Metsch',
      author_email='thijs.metsch@opensolaris.org',
      install_requires=['pyramid'],
      classifiers=[
                     'Operating System :: OS Independent',
                     'Programming Language :: Python',
                    ],
     )
Please note the install_required parameter. Using this parameter will ensure that during deployment of you app the necessary requirements get installed – in this case Pyramid.
The following steps are pretty straight forward. The file application in the wsgi directory is as the name states a simple WSGI app. What we need to do is edit this file and let it call the todo app:
#!/usr/bin/python

import os

virtenv = os.environ['APPDIR'] + '/virtenv/'
os.environ['PYTHON_EGG_CACHE'] = os.path.join(virtenv, 'lib/python2.6/site-packages')
virtualenv = os.path.join(virtenv, 'bin/activate_this.py')
try:
    execfile(virtualenv, dict(__file__=virtualenv))
except IOError:
    pass

from todo import application
Please note that the file has no ‘.py’ extension.
Now we are ready to create the finally application. Please have a look at this tutorial as the code will almost be identical.
Create a file todo.py and follow the tutorial as described. Make sure you application runs locally. Put the ‘*.mako’ files in the subdirectory static under the wsgi directory. You can place the schema.sql file in the data directory. We will be using a sqlite database which will also be place in there.
The final step is to alter the todo.py file and remove the __main__ part. Instead we will introduce the following application function:
here = os.environ['OPENSHIFT_APP_DIR']

def application(environ, start_response):
    '''
    A WSGI application.

    Configure pyramid, add routes and finally serve the app.

    environ -- the environment.
    start_response -- the response object.
    '''
    settings = {}
    settings['reload_all'] = True
    settings['debug_all'] = True
    settings['mako.directories'] = os.path.join(here, 'static')
    settings['db'] = os.path.join(here, '..', 'data', 'tasks.db')

    session_factory = UnencryptedCookieSessionFactoryConfig('itsaseekreet')

    config = Configurator(settings=settings, session_factory=session_factory)

    config.add_route('list', '/')
    config.add_route('new', '/new')
    config.add_route('close', '/close/{id}')

    config.add_static_view('static', os.path.join(here, 'static'))

    config.scan()

    return config.make_wsgi_app()(environ, start_response)
When done we can push the code to the repository. When done you can visit you application at the given URL.
With this I’ve been able to create the app http://todo-sample.rhcloud.com/ and I also deployed my OCCI example service: http://occi-sample.rhcloud.com/. As you can see pretty straight forward & fast and of course fun!
What would be fun is to create a simple unittesting framework for OpenShift. For now you can find the code pieces at github.
Categories: Personal • Tags: OCCI, Python • Permalink for this article
Page 3 of 8«12345...»Last »


