April 1st, 2012 • Comments Off on Python DTrace consumer and AMQP
This blog post will lead through an very simple example to show how you can use the Python DTrace consumer and AMQP.
The scenario for this example is pretty simple – let’s say you want to trace data on one machine and display it on another. Still the data should be up to date – so basically whenever a DTrace probe fires the data should be transmitted to the other hosts. This can be done with AMQP.
The examples here assume you have a RabbitMQ server running and have pika installed.
Within this example two Python scripts are involved. One for sending data (send.py) and one for receiving (receive.py). The send.py script will launch the DTrace consumer and gather data for 5 seconds:
thr = dtrace.DTraceConsumerThread(SCRIPT, walk_func=walk)
thr.start()
time.sleep(5)
thr.stop()
thr.join()
The DTrace consumer is given an callback function which will be called whenever the DTrace probes fire. Within this callback we are going to create a message ad pass it on to the AMQP broker:
def walk(id, key, value):
    channel.basic_publish(exchange='', routing_key='dtrace', body=str({key[0]: value}))
The channel has previously been initialized (See this tutorial on more details). Now AMQP messages are passed around with up-to-date information from DTrace. All that there is left is implementing a ‘receiver’ in receive.py. This is again straight forward and also works using a callback function:
def callback(ch, method, properties, body):
    print 'Received: ', data

if __name__ == '__main__':
    channel.basic_consume(callback, queue='dtrace', no_ack=True)
    try:
        channel.start_consuming()
    except KeyboardInterrupt:
        connection.close()
Start the receive.py Python script first. Than start the send.py Python script. You can even start multiple send.py scripts on multiple hosts to get an overall view of the system calls made by processes on all machines 🙂
The send.py script counts system calls and will send AMQP messages as new data arrives. You will see in the output of the receive.py script that data arrives almost instantly:
$ ./receive.py
Received:  python 264
Received:  wnck-applet 5
Received:  metacity 6
Received:  gnome-panel 15
[...]
Now you can build life updating visualizations of the data gathered by DTrace.
Categories: Personal • Tags: Analytics, DTrace, Python • Permalink for this article
March 29th, 2012 • Comments Off on Python DTrace consumer meets the web
I had look at my Python DTrace consumer yesterday night and realized it need a bit an overhaul. I already demoed that you can make some visualization with it – like life updating callgraphs etc. Still it missed some basic functionality. For example I did only support some DTrace aggregation actions like sum, min, max and count. Now I added support for avg, quantize and lquantize.
Now I just needed to write about 50 LOC to do something nice 🙂 Those ~50 lines are the implementation of an WSGI app using Mako as a template engine. Embedded in the Mako templates are Google Charts. And those charts actually show information coming out of the Python consumer. Now all what is left, is to point my browser to my SmartOS machine and get up-to-date graphs! For example a piechart which shows system calls by process:

Click to enlarge
Or using quantize I can browse a nice read size distribution – aka: how much bytes do my processes usual read?:

Click to enlarge
With all this it is also possible to plot graphs on the latency of node.js apps :-):

Click to enlarge
Again documentation on writing DTrace consumers is almost non-existent. But with some ‘inspiration’ from Bryan Cantrill and the original C based consumer I was able to get it work.
Categories: Personal • Tags: Analytics, DTrace, Python, SmartOS • Permalink for this article
April 2nd, 2011 • Comments Off on Fun with Joyent’s Node.js cloud analytics
Since Joyent release their no.de service I wanted to give it a try. Especially since they added an analytic feature based on DTrace which is described in all details here: Joyent’s wiki. Also nice is this blog post.
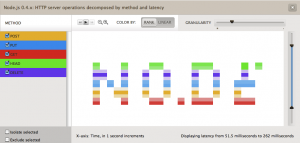
So I was tempted to play around with both for a while now. Finally I came up with the idea of drawing words in the analytics panel of the no.de service. Just like a stock exchange ticker with some scrolling test.
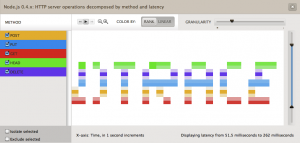
So I wrote a simple server.js which responses to different HTTP method (POST, PUT, GET, DELETE, HEAD) request with different latencies. I created an instrumentation in the cloud analytics panel of the no.de service for HTTP server operations (method) over latency. Now only thing left was to write some python code to execute concurrent HTTP requests using different HTTP methods. So 5 concurrent requests with HTTP GET, POST, PUT, DELETE and HEAD would result in vertical 5 dots. 3 concurrent request with HTTP HEAD, PUT and GET in 3 vertical dots with some space between them. I guess you get the picture.
Here are some screenshots:


Hardest part was to figure out the right values for the latencies. Took a while to figure out those who printed the nicest characters without too many ‘drawing erros’.
Categories: Personal • Tags: Analytics, DTrace, Joyent, Python • Permalink for this article


