Analytics as a Service
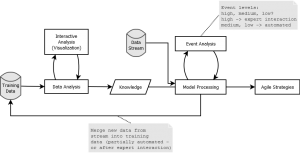
October 15th, 2013 • 2 CommentsWith this blog post I try to summarize some key concepts/definitions of something called an Analytics-as-a-Service (AaaS). The AaaS – named Suricate – described in this post , was developed as part of my Masterthesis. The Masterthesis was about learning application/service behavior and then be able to abstract models from that, to create agile systems/strategies. This could reach from simple fault-detection up to reconfigurations (e.g. auto scaling) of the application/service instance of the platform (Cloud/whatever) it runs upon. Originally it was used to take data aggregated from DTrace using Python, parse models from it using scikit-learn, continuously compare (and update) models with new incoming data, and finally process/take actions. This process requires sometimes user interactions (from Data Scientist or whatever you wanna call them) as can be seen in the following diagram:
Eventually, when my Masterthesis was done (with much more in it then just the development of Suricate in it – talking algorithms/concepts to create models etc), I thought it could serve some more general purpose. In short (tl;dr 🙂) Suricate:
- allows you to upload or stream data so the Service can aggregate it.
- allows a Data Scientist to perform Analytics and visualize the results.
- supports the processing and acting (trigger actions) on the analysis and thereby the creation of continuously adjusted agile Systems & Strategies based on up-to-date insights.
Concepts of an Analytics as a Service
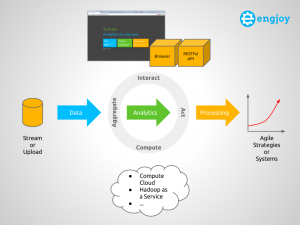
The following diagram shows a conceptual overview of Suricate, which will be used to explain some key concepts of an AaaS.
Overall the four main concepts for an AaaS therefore are:
- Aggregate – Supplying user defined data: Stream data into the service or upload the data in an internal or external Storage (Object, Relational, etc). The data can then be aggregated, pre-processed and cached.
- Interact – Supplying user defined logic (this is where the IP is in – create marketplace for this if you want :-)): Use Python interactive scripting capabilities to perform analytics and visualize (visualizations are sometimes key to understanding :-)) the results. The Data Scientist can interact with the Service via a Web UI or REST API.
- Compute – Uses other services (potentially compute or things like Hadoop) to perform the computational aspect of the analytics.
- Act – Process the learned models and trigger actions on insights gained, to create agile Systems & Strategies.
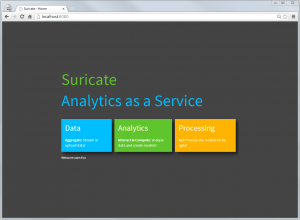
Other example of AaaS are Quantopian or DataHero btw. There are plenty of other around, but most of them are focused on Business Analytics. But sometimes the streaming data & ‘Acting’ part is missing from all of them. When running Suricate one is first greeted with the overview page. Those ’tiles’ reflecting the main concepts of an AaaS:
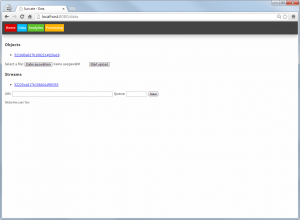
In the data page, files can be uploaded as objects and AMQP streams can be defined:
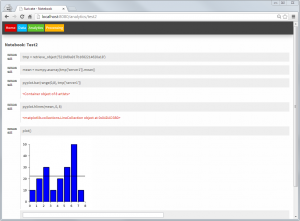
In the Analytics part notebooks – just like with IPython – can be written. Within these notebooks toolkits such as matplotlib, scikit-learn or Python Pandas can easily be used. Using these toolkits models can be created within this part and stored again as objects (or even use them to retrieve/download data from somewhere). Also packages to enable faster computation of models can be integrated, as a full Python interpreter is at hands. Python is an ideal language for data processing/analytics and learning btw [1], [2] – although R could be integrated too.
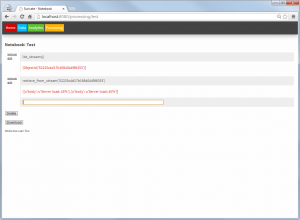
The Processing part looks similar to the Analytics part. Again notebooks can be created. But these notebooks now use the models created earlier, to compare them with new incoming data (from AMQP) streams and take actions accordingly.
It is noted here that both the processing and the Analytics notebooks can be triggered externally (through an API), and therefore create a true continuously Analytics framework.
Suricate’s source code is available (without warranty – Open Source – in early stages etc. as it is mainly a Demonstrator/PoC for my thesis) on GitHub. Feel free to extent it etc. It happily runs on PaaS like OpenShift as it is an simple WSGI application.
[…] few line lines of Python code, a big CSV file, some help of Python Pandas, Suricate and about 20 minutes is all it takes to answer the following […]
[…] a little excerpt on stuff you can do with the help of Suricate. Again we’ll look at play-by-play statistics. So no information on which play was performed, […]