Web based DTrace Mini-IDE
May 20th, 2012 • 3 CommentsIn previous blogposts I already demoed what a Python based DTrace consumer can be used for: live inspection (callgraphs) of running programs, nice Visualizations or just plain tracing. Especially with SmartOS (as one of the many platforms which have DTrace support)I found it a bit annoying to deal with DTrace. Since SmartOS is headless itself I was thinking about creating a web based editor for DTrace scripts which would than create nice visualizations of the aggregated data. This simple IDE is written as an Django application and makes use of the Python based DTrace consumer.
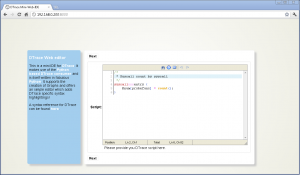
So here it is a first shot of the DTrace web based Mini-IDE (couldn’t come up with a better name :-))
As you can see it is running inside of Chrome on a Windows box – just to make sure you believe it is indeed web based. Now let’s take a look at all the features:
Syntax highlighting & Error detection
The user is guide through 3 steps – Writing the DTrace script, running it and then the output is shown. The editor in the first step features a DTrace specific syntax highlighting. Variables, Build-in variables, functions, aggregation functions and a set of providers are highlighted accordingly. Comments are also parsed in a certain color.
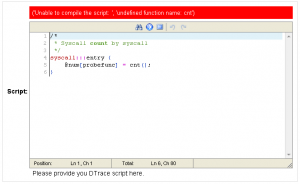
Next to this the editor will try to compile the script and show possible errors. The following screen-shot shows that when an unknown aggregation function is used the error is reported. It will use the Python binding for libdtrace to compile the script and return any errors:
Running DTrace
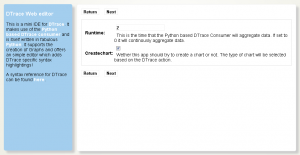
When clicking next to reach the next step a set of options are shown. The user can insert the time in seconds which DTrace should aggregate data (In this case 2 – or 0 when continuously aggregate data) and check if a chart should be generated from the aggregated data:
Displaying the result
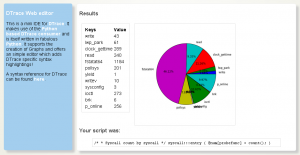
When done the aggregated Data will be displayed. E.g. when you used the following one liner (syscall count by syscall):
syscall:::entry {
    @num[probefunc] = count();
}
The result is displayed as a pie chart:
Or to give another example (A read distribution):
syscall::read:entry {
    @dist[execname] = lquantize(arg0, 0, 12, 2);
}
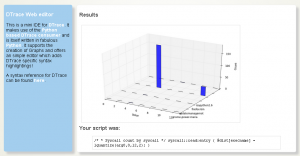
The result would be a bit different since the aggregation function lquantize is used. The data is displayed from 0 to 12 in steps of 2. The Z-Axis shows the name of the executable:
This is great! Would you be willing to share the source?
Sure! The Python DTrace consumer is already out there – I just need some time to clean up some edges in the django app and I’ll push it on github. As usual time is the only problem 🙂 Cheers!
See GitHub for the code 😀