July 16th, 2013 • Comments Off on Learn Service Behaviour
This started off as just an idea in my head a while ago and soon become my Master thesis. The idea is to apply Machine Learning/Data Analysis methodologies to Data derived from tools such as DTrace. Based on the learned knowledge it would then be possible to create adaptive/agile systems. For example to balance out your workload as a service provider overnight. Or move your compute close to your data. Or to learn how to best configure your system (by using Software Defined Networking). Or to simple tune your threshold values in your monitoring system etc. Or you name it – it might be doable.
After finally finishing my Master thesis – doing that next to work is quite a challenge I can tell now 🙂 – I can certainly say that some stuff can indeed be learned. During the work on my thesis I sketched out a, in browser programmable (Python of course :-)), Analytics as a Service (I just like the acronym for it :-)) which can be used learn from Data derived from DTrace (See 1).
As a first step it is useful to select the resources you want to look at. The should have a relevance to the behavior of the applications and services. The USE Method demoed by Brendan Gregg might be a good start. Once you know what you want to look for it is possible to gather some data. For example using the DTrace consumer for Python (See 2), like I did. Cool think is now that thanks to Python you can send it around (pika), store it (MongoDB, sqlite) and process it (scikit-learn) easily. Just add a few API for abstraction, a rich web application for creating python notebooks and you have the Analytics as a Service.
Now we can work through the data with some simple steps.
- Step 1 – Analyze the time series you got with some first methods. This could reach from calculating means, averages, etc over smoothing or regression analyses to looking into correlations in the data. Now you will have a good knowledge of which time series are interesting for further analysis.
- Step 2 – Cluster the applications/services based on the data points to get an first overview of how they fit together. Again simple k-means clustering can be an initial step. Remember sometimes the simplest methods are the best 🙂
- Step 3 – Based on what has been learned till now try to apply mechanism to analyze the covariance/correlation between the applications/services. Once done you get a nice graph which represents behavior of your overall environment.
- Step 4 – Go beyond the simple and try to build Bayesian networks on what you got now. Go look at decision trees if possible to try build that adaptive/agile system.
- Step 5 – Well as usual the sky might actually be the limit.
Results of each of the steps can be seen as models which can be compared with new incoming data from DTrace. Based on the ‘intelligence’ of the comparison of the new date with the learn model (knowledge) the adaptive/agile system can be build. Continuously updating your learned model in the learning process is key – we don’t want to ‘predict’ the future using a crystal ball. This is just the tip of the iceberg of all stuff worked on and discovered in my Master thesis – but as usual – so little time so much to do 🙂 But maybe I’ll find some time soon to sketch out the learning process and share some details of what I was able to let the computer learn…
Categories: Personal • Tags: Analytics, Data Science, DTrace, Machine Learning, OpenSolaris, Python, SmartOS • Permalink for this article
March 24th, 2013 • Comments Off on Learning application behavior
I have been working for a while now on bringing together some very interesting topics. Machine learning/data analysis tools and the platform I like: SmartOS with it’s great DTrace tooling. This is a first post on this topics with some very early results 🙂
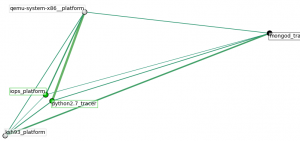
The following graph shows the dependencies between some processes (got way more in my dataset). The ones with ‘*_tracer‘ run within a zone. Whereas the ‘*_platform‘ are coming from the global SmartOS zone. To make it more complete also I/O of the platform are taken into account, so we do not just look at the processes. The graph shows the ‘links’ between the processes (e.g. python) & other data sources (iops):

Inter-dependencies of proccesses
What happened within the time-frame of the training data was that another zone with an KVM VM instances got started, hence the ‘qemu‘ process running. First a cluster analysis was used to see the rough interdependence of the sources. The edges express the ‘strength’ of an link between data sources – this was inspired by this.
You can see that the start of a VM leads to some I/O operations, logically. The python process you can see has a strong link to the qemu process for no particular reason. This is because it was collecting data using the DTrace consumer. So it just happens that is was very active while the KVM got started. As said this is a first shot. Certainly the selection to which data sources to look at needs to be optimized. Plenty of possibilities there since I used DTrace to gather a fair amount of data.
Also it will be interesting to look at different application setups. This was data gathered during a VM start up. First experiments while looking at web severs (the httpd process and incoming tcp connections) already bring up different graphs. So why is this cool? When an machine can learn the behavior (graphs like above) it can identify misbehavior based on new incoming data from a DTrace probes. Also this could be used to tune the setup & configurations of a system.
Again these are very early results – just got excited and wanted to post something 🙂 Definitely the cluster analysis which is carried out needs to be tuned as well.
What was used to get this done:
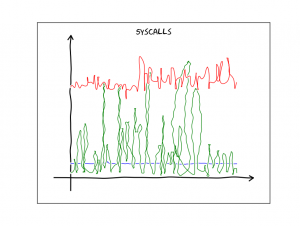
And just for fun since I discovered this nice XKCD plotting extension to matplotlib – a graph which show the # of system calls per process over time in xkcd ‘style’:

System calls per process over time
Categories: Personal • Tags: Analytics, DTrace, Machine Learning, Python, SmartOS • Permalink for this article
March 29th, 2012 • Comments Off on Python DTrace consumer meets the web
I had look at my Python DTrace consumer yesterday night and realized it need a bit an overhaul. I already demoed that you can make some visualization with it – like life updating callgraphs etc. Still it missed some basic functionality. For example I did only support some DTrace aggregation actions like sum, min, max and count. Now I added support for avg, quantize and lquantize.
Now I just needed to write about 50 LOC to do something nice 🙂 Those ~50 lines are the implementation of an WSGI app using Mako as a template engine. Embedded in the Mako templates are Google Charts. And those charts actually show information coming out of the Python consumer. Now all what is left, is to point my browser to my SmartOS machine and get up-to-date graphs! For example a piechart which shows system calls by process:

Click to enlarge
Or using quantize I can browse a nice read size distribution – aka: how much bytes do my processes usual read?:

Click to enlarge
With all this it is also possible to plot graphs on the latency of node.js apps :-):

Click to enlarge
Again documentation on writing DTrace consumers is almost non-existent. But with some ‘inspiration’ from Bryan Cantrill and the original C based consumer I was able to get it work.
Categories: Personal • Tags: Analytics, DTrace, Python, SmartOS • Permalink for this article
March 23rd, 2012 • Comments Off on Python DTrace consumer on SmartOS
As mentioned in previous blog posts (1 2 3) I wrote a Python DTrace consumer a while ago. The cool thing is that you can now trace Python (as provider) and consumer the ‘aggregate’ in Python (as consumer) as well :-). Some screen-shots and suggestions what you can do with it are described on the github page.
I did not have much spare time lately but I got the a chance last night to test my Python based DTrace consumer on SmartOS, Solaris 11 and OpenIndiana – and can confirm that it runs on all 3.
To get it up and running on SmartOS you will first need to install some dependencies. Use the 3rd party repositories as described in the SmartOS wiki to get pkg up and running:
pkg install git gcc-44 setuptools-26 gnu-binutils
When that is done we will clone the consumer code and install cython (you could however also use ctypes) using pip:
easy_install pip
pip install cython
git clone git://github.com/tmetsch/python-dtrace.git
cd python-dtrace/
python setup.py install
Now since this is done we can do the obligatory ‘Hello World’ to get things going:

Python DTrace consumer on SmartOS (Click to enlarge)
For more examples refer to the examples folder within the python-dtrace repository.
Categories: Personal • Tags: DTrace, Python, SmartOS • Permalink for this article
February 28th, 2012 • Comments Off on SmartStack = SmartOS + OpenStack (Part 3)
This is the third part os the blog post series. Previous parts can be found here: 1 2
To ensure the proper startup of nova-compute we will register it using SMF – this will also increase the dependability of the services. To start we will define a properties file for nova-compute – we will be using a glance and rabbitMQ host which run on a different host:
--connection_type=fake
--glance_api_servers=192.168.56.101:9292
--rabbit_host=192.168.56.101
--rabbit_password=foobar
--sql_connection=mysql://root:foobar@192.168.56.101/nova
We will store this contents in the file /data/workspace/smartos.cfg. We will also create an XML file with the manifest definition – it has some dependencies defined:
<?xml version='1.0'?>
<!DOCTYPE service_bundle SYSTEM '/usr/share/lib/xml/dtd/service_bundle.dtd.1'>
<service_bundle type='manifest' name='openstack'>
<service name='openstack/nova/compute' type='service' version='0'>
<create_default_instance enabled='true'/>
<single_instance/>
<dependency name='fs' grouping='require_all' restart_on='none' type='service'>
<service_fmri value='svc:/system/filesystem/local'/>
</dependency>
<dependency name='net' grouping='require_all' restart_on='none' type='service'>
<service_fmri value='svc:/network/physical:default'/>
</dependency>
<dependency name='zones' grouping='require_all' restart_on='none' type='service'>
<service_fmri value='svc:/system/zones:default'/>
</dependency>
<exec_method name='start' type='method' exec='/usr/bin/nohup /data/workspace/nova/bin/nova-compute --flagfile=/data/workspace/smartos.cfg &' timeout_seconds='60'>
<method_context>
<method_environment>
<envvar name="PATH" value="/ec/bin/:$PATH"/>
</method_environment>
</method_context>
</exec_method>
<exec_method name='stop' type='method' exec=':kill' timeout_seconds='60'>
<method_context/>
</exec_method>
<stability value='Unstable' />
</service>
</service_bundle>
This can be imported using the svccfg command. After doing so we can use al the known commands to verify all is up and running:
[root@08-00-27-e3-a9-19 /data/workspace]# svcs -p openstack/nova/compute
STATE          STIME    FMRI
online         14:04:52 svc:/openstack/nova/compute:default
               14:04:51     3142 python
Now up to integrate vmadm…
Categories: Personal • Tags: Cloud, SmartOS • Permalink for this article


